Power BI · supply chain
Profit told a different story from revenue
Which products, regions, and shipping choices actually supported profit?
Why this question matters
High sales do not always create strong margins. The report was designed to help a business stakeholder see where profit came from and where a shipping promise might need attention.
How I approached it
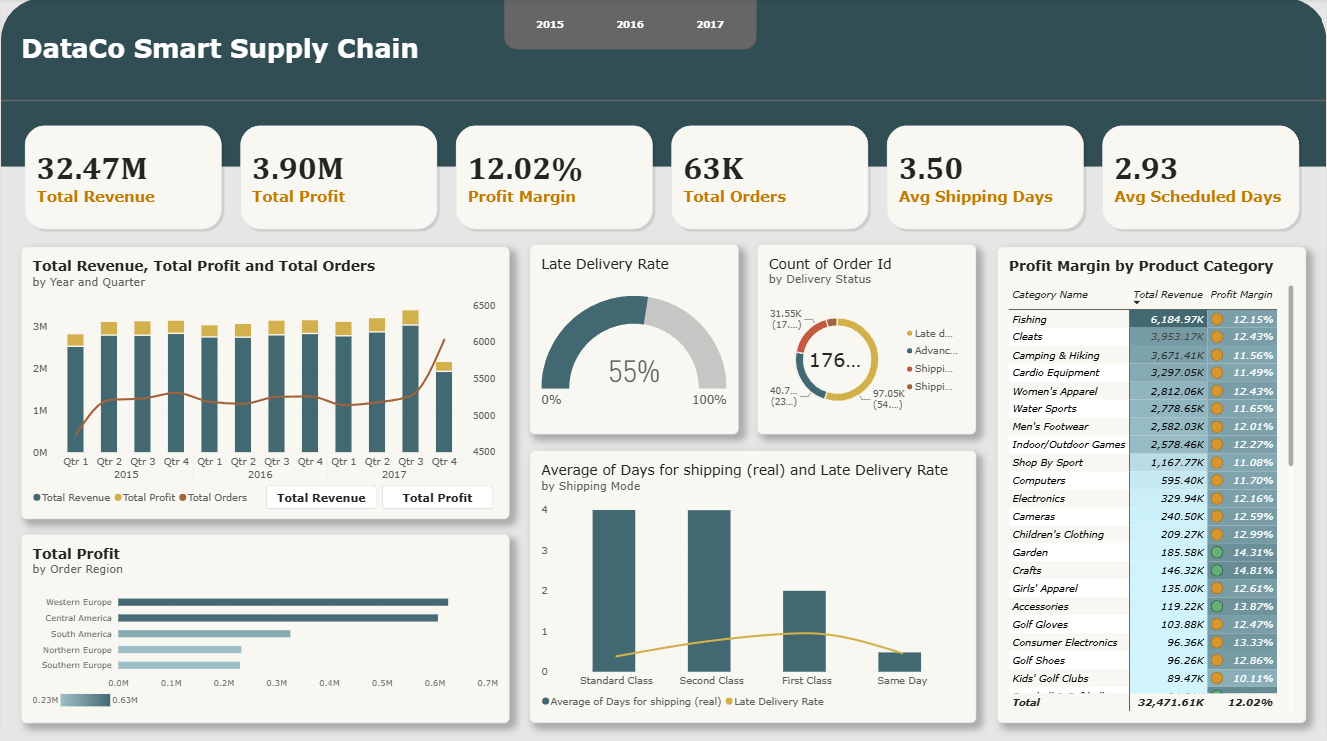
I shaped about 180,000 order lines with Power Query, built measures in DAX, and designed a two-page Power BI report. I excluded 2018 because it was only a partial period and removed personal customer fields that were not needed for the analysis.
What the evidence showed
- Fishing led revenue at about $6.2 million, while Garden and Crafts achieved higher profit margins of 14.31% and 14.81%.
- First Class averaged two shipping days but was late 95% of the time. Standard Class averaged four days but was late 38% of the time. The promised window, rather than absolute speed, appears to drive much of this difference.
- Western Europe and Central America accounted for a large share of profit.
The decision it supports
Investigate whether high-margin categories can grow and whether the faster shipping classes promise dates that are too tight. Treat cancellations and late deliveries as separate problems.
Where the evidence stops
The report describes patterns in 2015–2017 data. It does not prove what caused lateness or how today’s customer demand would respond to a change.